Microsoft Visio: Ever felt the frustration of trying to explain a complex process or system with just words? Visio’s your answer. It’s the diagramming software that lets you visualize everything from simple flowcharts to intricate network architectures, making complex information instantly understandable. Whether you’re a project manager wrestling with timelines, a network admin mapping out your infrastructure, or a student trying to visualize a concept, Visio’s got you covered.
This guide dives into the core functionality of Microsoft Visio, exploring its features, comparing it to competitors, and showcasing its versatility across various industries. We’ll cover everything from creating basic diagrams to mastering advanced techniques like data linking and visualization, ensuring you can harness Visio’s full potential. Get ready to unlock the power of visual communication!
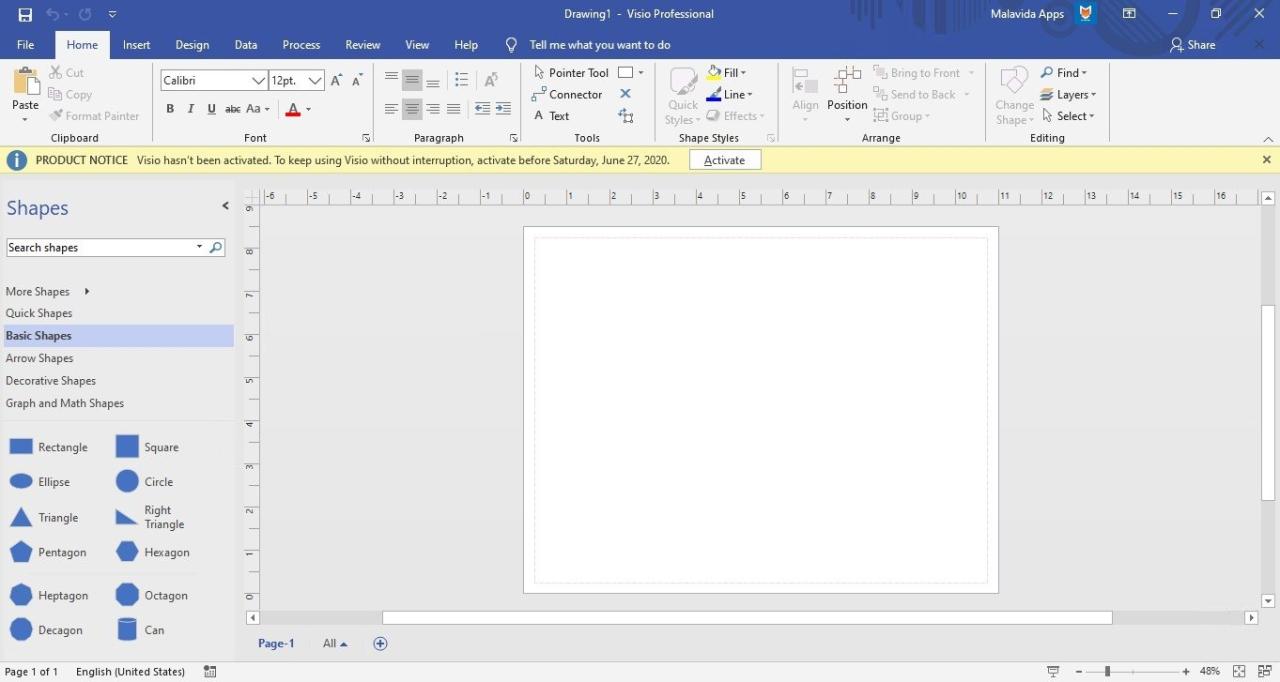
Visio’s Core Functionality
Visio is a diagramming tool that allows users to create a wide variety of visuals, from simple flowcharts to complex network diagrams. It’s incredibly versatile and used across many industries to visually represent information, making complex ideas easier to understand and share. Think of it as the ultimate visual communication tool for professionals.Visio’s core functionality centers around its ability to create and manipulate shapes, connect them with lines and connectors, and organize them into meaningful diagrams.
It offers a robust library of pre-made shapes, templates, and stencils, drastically speeding up the diagramming process. Beyond the basic drawing tools, Visio also provides features for data linking, collaboration, and sharing finished diagrams.
Types of Diagrams Created in Visio
Visio supports a vast range of diagram types. Users can create flowcharts, network diagrams, organizational charts, UML diagrams, floor plans, timelines, and much more. The software’s flexibility allows it to adapt to various needs, from visualizing business processes to designing physical spaces. The extensive template library provides a starting point for many common diagram types, reducing the time spent on initial setup.
Industries Utilizing Visio
Visio’s applicability spans numerous industries. IT professionals heavily rely on Visio for network mapping and system architecture diagrams. Business analysts use it for process mapping and workflow optimization. Engineers utilize Visio for creating technical drawings and schematics. Even architects and construction managers use it for designing floor plans and building layouts.
Essentially, any field requiring visual representation of information can benefit from Visio’s capabilities.
Simple Flowchart Example, Microsoft visio
Let’s illustrate Visio’s core features by designing a simple flowchart for ordering a pizza. We’ll use basic shapes like rectangles (for processes), diamonds (for decisions), and arrows (for flow).
| Step | Description | Visio Shape |
|---|---|---|
| 1 | Decide if you want pizza | Diamond |
| 2 | Yes: Open pizza ordering app | Rectangle |
| 3 | Select pizza type and toppings | Rectangle |
| 4 | Review order | Rectangle |
| 5 | Confirm order | Rectangle |
| 6 | No: Go do something else | Rectangle |
| 7 | Wait for delivery | Rectangle |
| 8 | Enjoy your pizza! | Rectangle |
Visio vs. Competitors
Okay, so we’ve covered Visio’s core features. Now let’s dive into how it stacks up against the competition. The diagramming software market is pretty crowded, so understanding Visio’s strengths and weaknesses relative to other options is key. We’ll look at functionality, pricing, and overall value proposition.
Visio’s main competitors include Lucidchart, draw.io (now diagrams.net), and Adobe Illustrator. Each offers a slightly different approach to diagramming, catering to various user needs and skill levels. Choosing the right tool depends heavily on your specific requirements and budget.
Visio’s Capabilities Compared to Other Diagramming Software
Visio boasts a robust feature set, particularly strong in its support for complex diagrams and integrations within the Microsoft ecosystem. Its extensive stencil libraries, advanced shaping capabilities, and data linking features are significant advantages for users needing highly detailed and data-rich diagrams. However, competitors like Lucidchart offer a more user-friendly interface, often requiring less of a learning curve.
draw.io excels in its collaborative features and browser-based accessibility, while Adobe Illustrator, geared towards graphic design, provides unparalleled artistic control but might be overkill for simple diagramming tasks.
Strengths and Weaknesses of Visio Compared to Alternatives
Here’s a breakdown of Visio’s comparative advantages and disadvantages:
- Strengths: Powerful features for complex diagrams, excellent integration with other Microsoft products (like Excel and PowerPoint), extensive stencil libraries, strong data visualization capabilities.
- Weaknesses: Steeper learning curve compared to some competitors, can be expensive, less collaborative features compared to cloud-based solutions like Lucidchart and draw.io, not as intuitive for quick, simple diagrams.
Pricing Models of Visio and its Competitors
Visio’s pricing is typically subscription-based, often bundled with Microsoft 365 plans. This can make it cost-effective for organizations already invested in the Microsoft ecosystem. Competitors offer various pricing models, including free plans (often with limitations), subscription plans, and one-time purchases. Lucidchart, for example, has a free tier for individual use and various paid plans for teams and organizations.
draw.io offers a completely free, open-source version, while Adobe Illustrator is a subscription-based application typically part of the Adobe Creative Cloud suite. The pricing differences reflect the features and capabilities offered by each software.
Comparison Table: Visio vs. Competitors
This table summarizes key differences between Visio and three popular alternatives:
| Feature | Visio | Lucidchart | draw.io (diagrams.net) | Adobe Illustrator |
|---|---|---|---|---|
| Ease of Use | Intermediate to Advanced | Beginner to Intermediate | Beginner to Intermediate | Advanced |
| Collaboration Features | Good (with limitations) | Excellent | Excellent | Limited |
| Pricing Model | Subscription (Microsoft 365) | Free & Paid Subscriptions | Free & Paid (limited) | Subscription (Adobe Creative Cloud) |
| Integration with Other Software | Excellent (Microsoft Ecosystem) | Good (various integrations) | Good (various integrations) | Excellent (Adobe Ecosystem) |
| Advanced Features | Excellent (Data Linking, Advanced Shaping) | Good | Good | Exceptional (Vector Graphics) |
Advanced Visio Features
Visio’s power extends far beyond basic diagramming. This section dives into some of its more advanced capabilities, showcasing how you can leverage these features to create sophisticated and highly informative visuals. We’ll explore shape manipulation, complex diagram creation, and the integration of data for dynamic visualizations.
Mastering these techniques allows you to create diagrams that are not only visually appealing but also incredibly functional and insightful, transforming your data into easily understandable and actionable information.
Shapes and Stencils
Visio offers a vast library of pre-built shapes and stencils, categorized for various diagram types. However, the true power lies in understanding how to customize and combine these elements. You can easily resize, rotate, and layer shapes to create intricate designs. Furthermore, you can create your own custom shapes and stencils, ensuring your diagrams maintain a consistent look and feel, and perfectly reflect your specific needs.
For example, you might create a custom stencil for your company’s specific network hardware, complete with unique icons and data fields. This allows for faster and more efficient diagram creation in the future, promoting consistency across all your team’s work.
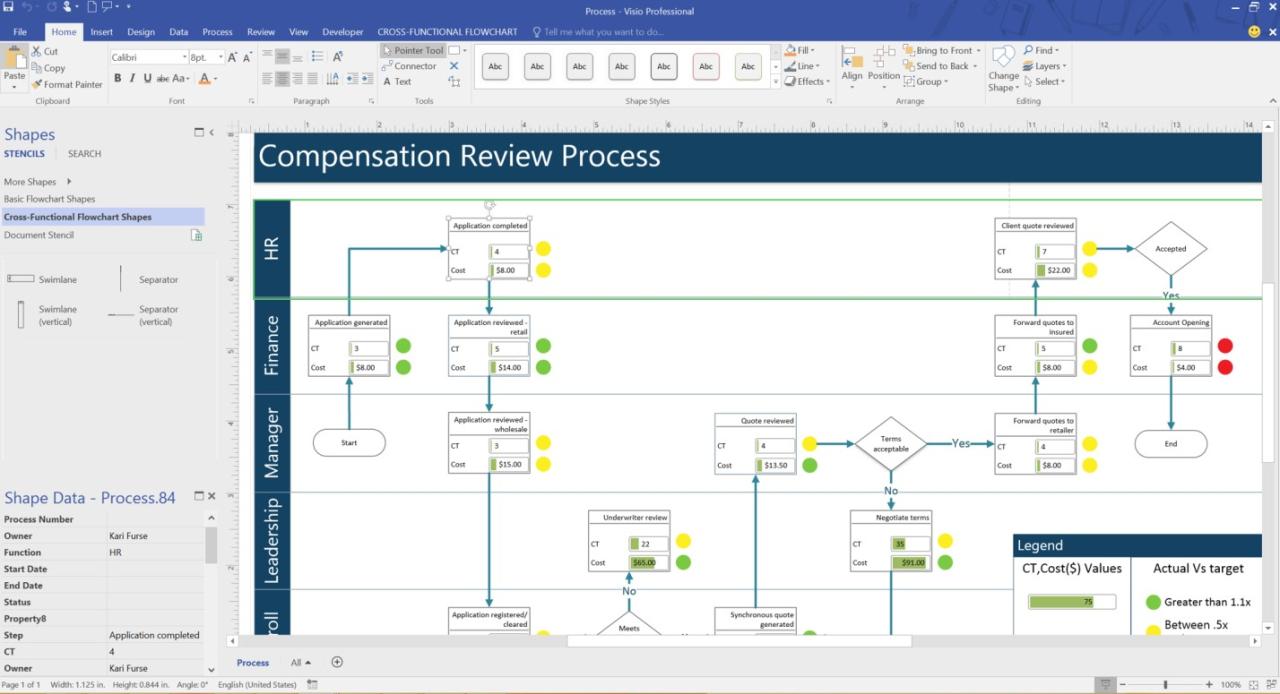
Advanced Techniques for Complex Diagrams
Creating complex diagrams involves strategic layering, grouping, and the use of containers. Layering allows you to control the visual hierarchy of your diagram, bringing certain elements to the forefront while others recede into the background. Grouping allows you to treat multiple shapes as a single unit, simplifying manipulation and organization. Containers, such as swimlanes in flowcharts or network segments in network diagrams, provide a way to visually organize large amounts of information, improving clarity and understanding.
Think of designing a complex organizational chart with multiple departments and reporting structures – skillful use of these techniques would be crucial for readability.
Data Linking and Visualization
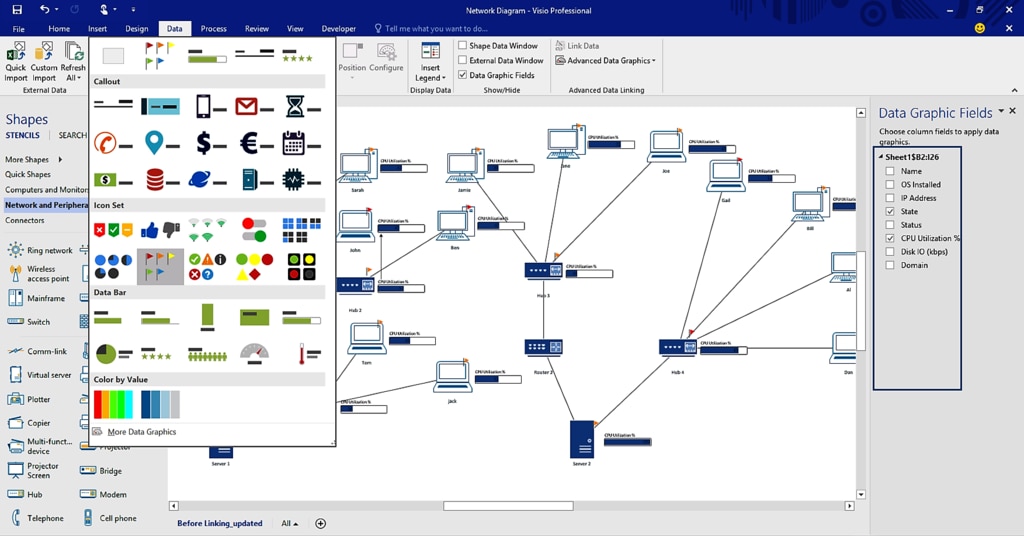
One of Visio’s most powerful features is its ability to link to external data sources, such as Excel spreadsheets or databases. This allows you to dynamically update your diagrams based on changes in your data. For example, you could link a network diagram to a spreadsheet containing information on network device performance. As the performance data changes, the diagram will automatically update, reflecting the current status of your network.
This capability is particularly useful for creating dashboards and reports that visually represent complex data relationships. You can use color-coding, shape size, and other visual cues to highlight key performance indicators and identify potential issues. Imagine a sales pipeline diagram dynamically updating with current sales figures – instantly providing a clear picture of progress and potential roadblocks.
Network Architecture Diagram
The following describes a sample network diagram. Imagine a diagram showing a three-tier architecture. The first tier, the Presentation Tier, is represented by three web servers, each labeled “Web Server 1,” “Web Server 2,” and “Web Server 3,” depicted as rectangular boxes with the label clearly visible inside. These servers are connected to a load balancer, a circular shape labeled “Load Balancer,” symbolizing the distribution of traffic.
The second tier, the Application Tier, consists of two application servers, labeled “App Server A” and “App Server B,” connected to the load balancer. These are represented by slightly smaller rectangles than the web servers. The third tier, the Data Tier, contains a database server, a larger rectangular box labeled “Database Server,” connected to both application servers. All connections between servers are shown as lines, with arrows indicating the direction of data flow.
Descriptive text, such as IP addresses or server specifications, could be added to each shape’s data field for more detail. This provides a clear, concise visual representation of the network’s structure and data flow, highlighting the different layers and their interconnections.
Visio Integration

Visio’s power isn’t just in its diagramming capabilities; it’s also in how seamlessly it integrates with the rest of the Microsoft 365 ecosystem. This tight integration streamlines workflows, improves collaboration, and makes data visualization incredibly efficient. Think of it as the central hub for your visual communication, effortlessly connecting with your other productivity tools.Visio’s import and export capabilities, along with its collaborative features, make it a versatile tool for teams of all sizes.
Data can be brought in from various sources, transformed into compelling visuals, and then easily shared and worked on collaboratively. This section will detail the specifics of these integrations and collaboration methods.
Visio’s Integration with Other Microsoft Applications
Visio boasts robust integration with other Microsoft applications, including Excel, PowerPoint, Word, and Project. Data from Excel spreadsheets can be directly linked to Visio diagrams, creating dynamic visuals that update automatically when the source data changes. This live connection is a game-changer for maintaining accurate and up-to-date diagrams. Similarly, Visio diagrams can be easily embedded into Word documents and PowerPoint presentations, enhancing reports and presentations with clear, concise visuals.
Project schedules can also be imported to create Gantt charts within Visio, providing a visual representation of project timelines and dependencies. This interconnectedness minimizes data duplication and ensures consistency across different applications.
Importing and Exporting Data in Visio
Importing data into Visio is straightforward. Users can import data from various sources, including Excel spreadsheets, databases (like Access), and text files. The process typically involves using the “Data Graphics” feature, which allows users to map data fields to shapes within the diagram. This creates data-driven visualizations where shapes’ properties (size, color, etc.) reflect the data. Exporting is equally simple; diagrams can be saved in various formats, including Visio’s native format (.vsdx), PDF, and image formats (like PNG, JPG).
This flexibility ensures that diagrams can be shared with individuals regardless of their software access.
Collaborating on Visio Diagrams
Collaboration in Visio is facilitated through several methods. Co-authoring allows multiple users to work on the same diagram simultaneously, streamlining the review and editing process. This real-time collaboration feature is particularly useful for large teams working on complex projects. Additionally, Visio diagrams can be stored in SharePoint, providing a centralized location for access and version control. Comments and annotations can be added directly to diagrams, enabling efficient feedback and review cycles.
The ability to check out and check in diagrams further ensures that edits are managed and conflicts are minimized.
Visio Integration Workflow with Microsoft Teams and SharePoint
A typical workflow showcasing Visio’s integration with Microsoft Teams and SharePoint could look like this:
- Step 1: Project Initiation in Teams: The project team initiates the project within a Microsoft Teams channel, defining objectives and roles.
- Step 2: Diagram Creation in Visio: A team member creates the initial Visio diagram, leveraging data imported from an Excel spreadsheet or other sources.
- Step 3: SharePoint Storage: The Visio diagram is saved to a designated SharePoint folder, ensuring centralized access and version control.
- Step 4: Collaborative Editing in Visio: Team members utilize Visio’s co-authoring feature to collaboratively edit and refine the diagram.
- Step 5: Feedback and Review in Teams: The team uses the Teams channel to provide feedback, utilizing comments and annotations within the SharePoint-stored Visio diagram.
- Step 6: Finalization and Distribution: Once finalized, the diagram is exported in a suitable format (PDF or image) and shared through the Teams channel or emailed to stakeholders.
This workflow leverages the strengths of each platform, combining the real-time communication of Teams with the centralized storage and version control of SharePoint and the powerful diagramming capabilities of Visio.
Visio for Specific Use Cases
Visio’s power lies in its versatility. It’s not just a diagramming tool; it’s a visual communication powerhouse adaptable to various fields. Let’s explore how Visio excels in specific professional contexts, focusing on project management, software development, and network visualization. We’ll see how its features translate into practical applications and improved workflows.
Project Management with Visio
Visio simplifies project visualization and management. Gantt charts, created easily within Visio, offer a clear timeline, highlighting tasks, dependencies, and milestones. This visual representation improves team communication and allows for quick identification of potential bottlenecks or delays. Furthermore, Visio’s ability to link diagrams to external data sources enables dynamic updates, reflecting real-time project progress. This reduces the chance of miscommunication and keeps everyone on the same page.
Software Development using Visio
Visio plays a crucial role in software development by facilitating clear communication and documentation. UML diagrams, readily created in Visio, help visualize software architecture, class structures, and workflows. These diagrams are invaluable during design phases, ensuring all team members have a shared understanding of the system’s design. Additionally, Visio can be used to document data flow, helping in identifying potential issues and optimizing the system’s efficiency.
The use of standardized notations ensures consistency and clarity across the development process.
Network Visualization in Visio
Network diagrams, created in Visio, provide a clear visual representation of a network’s infrastructure, including servers, routers, switches, and connections. This visual aid is essential for network administrators to understand the network topology, troubleshoot issues, and plan for future expansion. Visio’s ability to create layered diagrams allows for detailed representation of complex networks, while its data linking capabilities enable the integration of network performance data for a more comprehensive overview.
This makes identifying bottlenecks and potential failure points easier.
Project Timeline Diagram
The following is a description of a Visio diagram illustrating a project timeline. The diagram would utilize a Gantt chart format. The horizontal axis represents time (weeks), while the vertical axis lists individual tasks. Each task is represented by a bar, whose length corresponds to the task’s duration. Dependencies are visually shown through connecting lines between tasks.
Milestones are represented by distinct markers on the timeline. The overall appearance is clean and easy to understand, facilitating quick comprehension of the project’s progress and potential roadblocks.
| Milestone | Description | Target Date |
|---|---|---|
| Project Initiation | Kick-off meeting, team formation, and initial planning. | 2024-10-26 |
| Requirements Gathering | Collecting and documenting project requirements from stakeholders. | 2024-11-09 |
| Design Phase Completion | Finalization of the project design and architecture. | 2024-11-23 |
| Development Completion | All coding and development tasks are completed. | 2024-12-14 |
| Testing and QA | Thorough testing and quality assurance processes. | 2024-12-28 |
| Deployment | Launching the project into the production environment. | 2025-01-11 |
| Project Closure | Final documentation, project review, and team debriefing. | 2025-01-25 |
Visio Templates and Shapes
Visio’s power lies not just in its diagramming capabilities, but also in its extensive library of pre-built templates and the flexibility it offers for creating and customizing shapes. These features significantly reduce the time and effort required to create professional-looking diagrams, allowing users to focus on the content rather than the formatting. This section will explore the various types of templates available, how to customize shapes, and where to find additional resources.
Types of Visio Templates
Visio offers a wide array of templates categorized by purpose. These range from basic flowcharts and network diagrams to highly specialized templates for specific industries and applications. For instance, you’ll find templates for engineering, software development, business processes, and more. Many templates include pre-designed shapes and stencils specifically tailored to the diagram type, making it easy to get started.
The templates are designed to be user-friendly, even for those with limited Visio experience. Selecting the right template significantly streamlines the diagramming process.
Creating and Customizing Visio Shapes
Creating custom shapes in Visio empowers users to represent unique elements within their diagrams. The process involves using Visio’s shape-building tools to draw, modify, and combine basic shapes. Users can adjust size, color, fill, and add text to create visually distinct elements. More advanced features allow the creation of shapes with custom properties and connections, adding a level of sophistication to diagrams.
For example, you could create a custom shape representing a specific piece of hardware in a network diagram, complete with relevant attributes like memory and processing power. This level of customization is critical for accurate and detailed representations.
Resources for Additional Templates and Shapes
Beyond the built-in templates, a wealth of additional resources exists online. Microsoft’s own website provides downloads and updates to the Visio template library. Third-party websites and online communities offer user-created templates and shapes, expanding the possibilities significantly. These resources often cater to niche requirements or offer specialized designs not found in the standard Visio package. Searching for “Visio templates” or “Visio stencils” on the internet will reveal a multitude of options, ranging from free to commercial offerings.
Careful consideration of the source is important to ensure compatibility and quality.
Commonly Used Visio Templates and Their Applications
The usefulness of Visio is greatly enhanced by its wide range of pre-built templates. Here are some commonly used templates and their applications:
- Flowchart Template: Used to visually represent the steps in a process, often used in software development, business process modeling, and problem-solving.
- Network Diagram Template: Depicts the layout and connections within a computer network, essential for IT professionals and network administrators.
- UML Diagram Template: Creates diagrams using the Unified Modeling Language, crucial for software engineers and designers to visualize software architecture.
- Organizational Chart Template: Illustrates the hierarchical structure of an organization, useful for HR departments and management teams.
- Floor Plan Template: Used to design and plan the layout of a building or room, often used by architects, interior designers, and real estate professionals.
Troubleshooting Common Visio Issues
Okay, so you’re diving into Visio, and things aren’t going exactly as planned? Don’t worry, it happens to the best of us. Visio, while powerful, can sometimes throw some curveballs. This section will cover some common problems and offer solutions to get you back on track to creating those killer diagrams. We’ll walk through some typical errors, give you tips for keeping Visio running smoothly, and provide a handy troubleshooting guide.
Many Visio issues stem from simple mistakes, corrupted files, or resource limitations. Understanding the source of the problem is the first step to fixing it. Often, a quick reboot or file repair can solve the issue. For more persistent problems, a deeper dive into Visio’s settings and system resources may be needed.
File Corruption and Recovery
File corruption is a common culprit. Symptoms include Visio crashing upon opening a file, displaying garbled shapes, or showing error messages. To recover, try opening the file in Visio’s compatibility mode. If that fails, you might have to resort to recovering an earlier autosaved version if enabled, or, sadly, start over from a backup. Prevention is key – regularly saving your work and keeping backups are crucial.
Slow Performance and Optimization
Visio can become sluggish when dealing with extremely large diagrams or complex shapes. To optimize performance, consider simplifying your diagrams, reducing the number of shapes and layers, and using linked data sparingly. Closing unnecessary programs and ensuring sufficient RAM also helps. Regularly clearing Visio’s cache can also improve responsiveness. Think of it like decluttering your digital workspace – a cleaner environment makes everything run smoother.
Shape and Connector Issues
Sometimes, shapes behave unexpectedly, connectors refuse to connect, or text refuses to cooperate. These problems often arise from accidental layer locking, conflicting shape properties, or simply incorrect settings. Checking layer visibility and unlocking layers, resetting shape properties to default values, and verifying connector settings can resolve many of these issues. Also, make sure your shapes aren’t inadvertently grouped or hidden.
Troubleshooting Guide
Here’s a quick reference table for common Visio problems and their solutions:
| Problem | Solution |
|---|---|
| Visio crashes frequently | Check for updates, close unnecessary programs, increase RAM if needed, repair Visio installation. |
| File won’t open | Try opening in compatibility mode, look for autosaved versions, check file permissions. |
| Shapes are distorted or missing | Check layer visibility, ensure shapes aren’t accidentally grouped or hidden, repair the file. |
| Connectors won’t connect | Check connector settings, ensure shapes are not locked or grouped, verify layer visibility. |
| Visio runs slowly | Simplify diagram, reduce number of shapes and layers, close unnecessary programs, clear cache. |
| Printing issues | Check printer settings, adjust page setup, ensure the correct printer driver is installed. |
Security and Access Control in Visio
Protecting your Visio diagrams and the sensitive information they contain is crucial, especially when collaborating with others or storing them on shared networks. Visio offers several built-in features to manage access and safeguard your data, ensuring only authorized individuals can view or modify your work. Understanding these security features is key to maintaining data integrity and confidentiality.Visio’s security features are integrated to control access and protect sensitive data within diagrams.
These range from basic password protection to more advanced controls for managing permissions within a collaborative environment. Proper implementation of these features minimizes the risk of unauthorized access or modification of your Visio files, maintaining data integrity and compliance with security policies.
Managing Access Permissions for Visio Documents
Managing access permissions involves controlling who can open, edit, or print a Visio file. This is typically done through file-level permissions in the operating system (like Windows or macOS) and, if the file is stored on a network share or cloud service, through those services’ access control mechanisms. For instance, you can set permissions to allow only specific users or groups to have read-only access, preventing accidental or malicious changes.
Furthermore, the use of robust password protection adds an extra layer of security. Setting a strong, unique password for your Visio files is a fundamental step in protecting sensitive data.
Protecting Sensitive Data Within Visio Diagrams
Several methods exist for protecting sensitive data embedded within Visio diagrams. One approach is to avoid directly embedding sensitive information within the diagram itself. Instead, use the diagram to represent the data visually, linking it to external, securely stored data sources. This separates the visual representation from the actual sensitive information. Another strategy is to utilize Visio’s data linking capabilities to connect diagrams to secure databases or spreadsheets, allowing for updates without compromising the diagram’s security.
This approach allows for dynamic updates while maintaining the confidentiality of the underlying data.
Best Practices for Securing Visio Files
Implementing strong security measures for your Visio files requires a multi-faceted approach. The following best practices help to mitigate risks and protect sensitive information:
- Use Strong Passwords: Employ complex passwords that combine uppercase and lowercase letters, numbers, and symbols. Avoid easily guessable passwords.
- Regularly Update Visio: Keep your Visio software updated to benefit from the latest security patches and bug fixes.
- Restrict File Sharing: Only share Visio files with authorized individuals and use secure file-sharing methods. Avoid sending sensitive diagrams via insecure channels.
- Implement Access Control Lists (ACLs): If storing files on a network share, use ACLs to define granular permissions for individual users and groups.
- Regularly Back Up Files: Maintain regular backups of your Visio files to protect against data loss due to accidental deletion, hardware failure, or malware attacks.
- Use Version Control: Track changes to your Visio files using version control systems to monitor modifications and revert to previous versions if necessary. This is particularly important in collaborative environments.
- Data Encryption: Consider encrypting sensitive Visio files, especially those containing highly confidential information, using strong encryption algorithms.
Visio and Accessibility

Making your Visio diagrams accessible isn’t just a good idea—it’s crucial for ensuring everyone can understand and interact with your work. Accessibility means designing diagrams that are usable by people with a wide range of disabilities, including visual, auditory, motor, and cognitive impairments. By following accessibility best practices, you’re making your diagrams more inclusive and usable for a broader audience.Creating accessible Visio diagrams involves thoughtful consideration of several key features and techniques.
It’s about ensuring information is presented clearly and in a way that can be perceived and interpreted by assistive technologies like screen readers. This leads to a more inclusive and collaborative environment.
Alternative Text for Shapes and Images
Alternative text (alt text) is crucial for making your diagrams accessible to users of screen readers. Each shape and image in your Visio diagram should have descriptive alt text that explains its content and purpose. For example, instead of leaving the alt text blank for an image of a flowchart node, describe the node’s function: “Decision point: Does the customer meet the criteria?”.
Vague alt text like “image” or “chart” is unhelpful. Comprehensive alt text allows screen reader users to understand the visual information conveyed by shapes and images. Alt text should be concise but informative, providing the essence of the visual without being overly wordy.
Keyboard Navigation
Ensuring your Visio diagrams are fully navigable using only a keyboard is essential for users who cannot use a mouse. This means all elements within the diagram should be reachable and selectable using the Tab key. Properly structured diagrams, using logical tab order, facilitate keyboard navigation. Testing keyboard navigation is vital to identify and fix any areas where keyboard-only users might encounter difficulty.
This is especially important for complex diagrams with many interactive elements.
Color Contrast
Sufficient color contrast between text and background is vital for readability, especially for users with low vision. Using a tool to check the color contrast ratio (WCAG guidelines recommend a minimum ratio of 4.5:1 for normal text and 3:1 for large text) can help ensure your diagrams meet accessibility standards. Avoid using color alone to convey information; always provide alternative cues like patterns or labels.
For instance, don’t rely solely on color-coding to differentiate tasks in a Gantt chart; use distinct icons or labels in addition to color.
Accessible Tables
When incorporating tables into your Visio diagrams, ensure they are semantically structured. Clearly define header rows and columns so screen readers can accurately interpret the table’s data. This allows users to navigate the table efficiently and understand the relationships between rows and columns. Avoid using merged cells whenever possible, as they can disrupt the reading order for screen reader users.
Well-structured tables are easy to understand for everyone, regardless of assistive technology usage.
Checklist for Designing Accessible Visio Diagrams
It’s beneficial to use a checklist to ensure your diagrams meet accessibility requirements. A consistent approach helps maintain quality and avoids overlooking important details.
- Provide descriptive alt text for all shapes and images.
- Verify keyboard navigation is complete and intuitive.
- Ensure sufficient color contrast between text and background.
- Use clear and concise labels for all elements.
- Structure tables semantically with clear header rows and columns.
- Avoid using color alone to convey information; provide alternative cues.
- Test your diagram with assistive technologies (screen readers, keyboard-only navigation).
- Seek feedback from users with disabilities.
Future of Microsoft Visio
Visio’s future looks bright, fueled by the ongoing evolution of digital collaboration and the increasing demand for visual communication tools. We can expect to see significant advancements in areas like AI-powered features, enhanced collaboration capabilities, and deeper integration with other Microsoft products. The diagramming landscape itself is changing rapidly, pushing Visio to adapt and innovate to maintain its leading position.
Several key trends are shaping the future of diagramming software, influencing how Visio will likely evolve. Increased cloud adoption, the rise of collaborative workspaces, and the growing importance of data visualization are all impacting the design and functionality of diagramming tools. We’re also seeing a shift towards more intuitive interfaces and the incorporation of AI to automate tasks and enhance user experience.
These factors will undoubtedly play a crucial role in Visio’s development.
Predicted Visio Enhancements
Visio is likely to see several key enhancements in the coming years. We can anticipate more robust AI-powered features, such as automated diagram generation from data sources or intelligent suggestions for improving diagram clarity and consistency. Improved collaboration tools, allowing real-time co-editing and commenting, will further enhance team workflows. Expect deeper integration with Microsoft Teams and other collaborative platforms, making Visio an even more seamless part of the overall Microsoft 365 ecosystem.
Enhanced support for different diagram types, perhaps incorporating more specialized templates for emerging fields like data science or cybersecurity, could also be on the horizon. Finally, expect improvements to the user interface, making the software even more intuitive and accessible to a wider range of users. For example, imagine a future Visio that automatically suggests optimal layouts based on the type of diagram and data being used, similar to how some presentation software automatically arranges slides.
Speculative New Feature: AI-Powered Diagram Optimizer
This feature would leverage AI to analyze a Visio diagram and suggest improvements to its clarity, consistency, and overall effectiveness. The optimizer would assess factors such as node placement, connection routing, color schemes, and font choices. It would then provide specific recommendations, such as suggesting a more logical arrangement of nodes, simplifying complex connections, or improving the overall visual hierarchy.
The user could then accept or reject these suggestions, giving them the final say on the design. This feature would be incredibly beneficial for users who are less experienced in diagramming or those who need to create highly polished and professional-looking diagrams quickly. Imagine creating a complex network diagram; the optimizer could identify areas of clutter and suggest cleaner, more understandable layouts, leading to a significant improvement in the diagram’s readability and comprehension.
The benefit would be a significant time saving and an increase in the quality and clarity of diagrams created.
So, Microsoft Visio’s pretty useful for diagramming all sorts of stuff, right? I’ve been using it lately to map out workflows, and it’s especially helpful when visualizing the connections between different parts of a system, like when you’re trying to understand how data flows in something complex, such as emr systems. Then, you can use Visio to create a clean, easily-understood visual representation of that entire EMR system’s architecture, making it perfect for presentations or documentation.
Conclusion
From simple flowcharts to complex network diagrams, Microsoft Visio empowers you to visualize and communicate ideas effectively. We’ve explored its core features, compared it to alternatives, and uncovered advanced techniques to help you create professional-looking diagrams. Whether you’re a seasoned pro or just starting out, mastering Visio is an investment in clearer communication and more efficient workflows. So go forth and diagram!
FAQ Explained: Microsoft Visio
Is Microsoft Visio only for Windows?
Nope, it’s also available for Mac (though functionality might differ slightly).
Can I collaborate on Visio diagrams in real-time?
Yes, you can use features like co-authoring in Microsoft Teams or SharePoint.
How much does Microsoft Visio cost?
Pricing depends on the license type (standalone, subscription through Microsoft 365, etc.). Check Microsoft’s website for the latest pricing.
What file formats does Visio support?
Visio supports a range of formats, including its native .vsdx, .vsdm, PDF, and various image formats.
Are there free Visio alternatives?
Yes, there are many free diagramming tools available online, although they may lack some of Visio’s advanced features.